[Highlight Automatic Adj.]
Overview
Use the scanner to change the gamma curve. The gradation and background density of the highlighted part will be adjusted automatically.
Adjust if the gradation density reproduction of the highlighted part differs for each screen.
The following setting is required to use this function.
- Perform [Gamma Automatic Adj.].
- The procedure for making adjustments varies depending on the options installed.
- Normally, adjustment is done using [Highlight Automatic Adj.]. Use [Highlight Adjustment] to make fine tuning.
- Use white printing paper for this adjustment. If there is color on the paper, the color of the chart changes depending on that color, and the adjustment cannot be made correctly.
- For details about [Gamma Automatic Adj.], refer to [Adjustment / Maintenance].
- To make fine adjustments manually, refer to [Highlight Adjustment].
Setting Procedure
This section details the procedure for when neither Intelligent Quality Care Unit IQ-501 or Relay Unit RU-518m are installed.
The chart will be automatically measured if either of Intelligent Quality Care Unit IQ-501 or Relay Unit RU-518m is installed. In such a case, you can stop after step 6.
The contents of the chart to be output may differ.

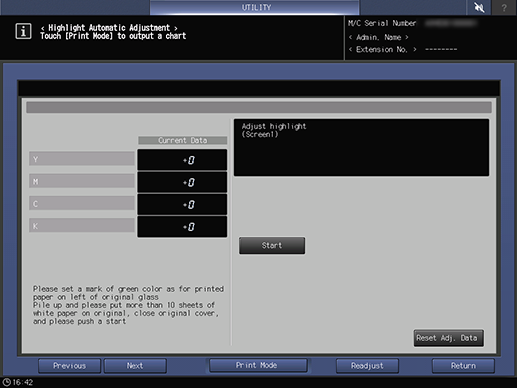
To set the highlight value to 0, press [Yes] in the dialog box that is displayed by pressing this item.

Press [Yes] when the confirmation dialog box is displayed.
A chart is output.

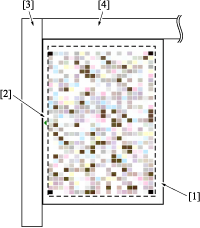
Set the triangle mark [2] on the chart [1] to the left and the print side facing down.
Move and touch chart [1] firmly against the vertical direction document size index [3] and horizontal direction document size index [4], and set to Original glass.

[Current Data] of [Y], [M], [C] and [K] is updated.
- [Completed normally] message will not display because the results of the 1st scanning do not determine whether the adjustment value is good or bad. Repeat steps 4 to 9 until [Completed normally] is displayed.
- If Error Code 1, 2 or 10 is displayed, check whether the chart is positioned correctly. If any other error code is displayed, contact your service provider.


 in the upper-right of a page, it turns into
  and is registered as a bookmark.