
Measuring the Chart
On the measurement screen, select a colorimeter and then start measurement.
preconditionTo measure a chart, install the driver of your colorimeter.
For details, refer to its manual.preconditionPatterns of charts and available sizes of paper vary among types of colorimeters.
preconditionAccording to the colorimeter, operations differ. For details, refer to its manual.
Select a colorimeter from Instrument on the chart measurement screen.
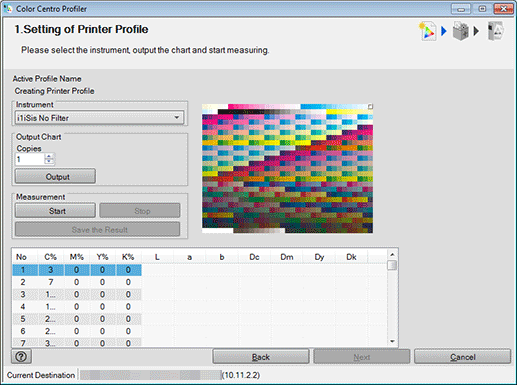
According to the selection, the chart image appears on the upper-right of the screen.
supplementary explanationi1iSis UV Cut returns the measurement result with the UV cut filter.
Specify the copy number of the chart outputting to Copies.
Click Output to print the chart.
Before you print the chart, perform calibration.
For details, refer to Overview of Calibration.
Click Start to start the measurement.
supplementary explanationAn operation screen for the colorimeter appears. Follow the instructions on the windows that follow.
supplementary explanationThe current position of measurement appears on the chart image of the upper-right of the screen.
supplementary explanationIf you measure a wrong line, a warning message appears. You can select either to try again with the correct line or to proceed to the next line.
supplementary explanationTo stop the measurement, click Stop.
supplementary explanationAfter the acquirement of measurement data, Save the Result becomes available.
supplementary explanationThe value of each patch appears in the measurement result list.
Click Save the Result after completing the measurement.
Save As screen appears.
Specify the saving place and file name, and click Save.
Returns to the Chart Measurement screen after saving the measurement result file.
Click Next.
The UCR/GCR Setting screen appears.
supplementary explanationGo to Select a Level of UCR and GCR.