
Calibration Manager Screen
About Calibration Manager screen
To display this screen, click Calibration on the Color Centro screen.
The components of the Calibration Manager screen vary depending on which advanced calibration is selected.
When Exact Color is selected
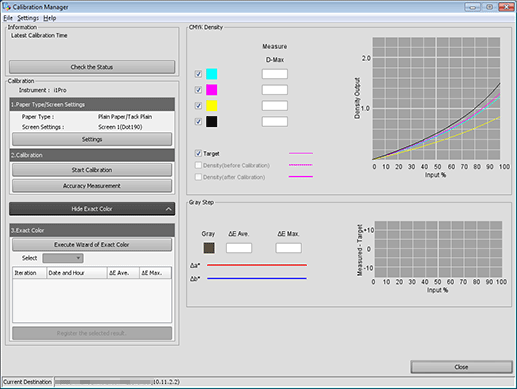
Configuration: Exact Color
Name | Description |
|---|---|
Information | Displays the date/time when the last calibration or scan calibration was executed. If Color Density Control is enabled, a message is displayed. |
Check the Status | Displays, per paper type for the selected screen setting, the screen type and the date/time when the data was registered. If scan calibration is executed, the relevant information is displayed in blue. |
Instrument | Displays the colorimeter that you select in Instrument on the Settings menu. |
Paper Type | Displays the paper type selected in Settings. |
Screen Settings | Displays the screen type selected in Settings. |
Settings | Allows you to set the paper type and screen type. |
Start Calibration | Starts calibration. |
Accuracy Measurement | Measures the accuracy of the calibration. |
Hide Exact Color | Hides 3.Exact Color and Gray Step. Clicking this item changes it to Open Exact Color. |
Open Exact Color | Shows 3.Exact Color and Gray Step. Clicking this item changes it to Hide Exact Color. |
Execute Wizard of Exact Color | Starts Exact Color. |
Select | Allows you to select, for the registration of Exact Color adjustment table, whether to register Exact Color adjustment data or to register data from your selected accuracy improvement session. |
List | Displays the results for calibration accuracy measurement, Exact Color adjustment accuracy measurement, and Exact Color adjustment accuracy improvement check. |
Register the selected result | Registers Exact Color data. |
C, M, Y, K | Allows you to select the curve to be displayed. Check to display curve. Remove check to not display curve. |
Measure D-Max | Displays measured D-Max when calibration is executed or calibration accuracy is measured. D-Max is the maximum density. If the measured value is too much lower than D-Max, the color of high density may not be reproduced well. It is the state in which the density is not enough. If the measured value too much higher than D-Max, the gradation may become rough. It is the state in which the output from 0% - 100% is performed with a smaller number of steps (example: 0% to 80%). |
Target | Displays the target curve for the paper recommended for the selected paper type when this item is checked. |
Density(before Calibration) | Switches between whether or not to display the graph from before the calibration. |
Density(after Calibration) | Switches between whether or not to display the graph from after the calibration. |
CMYK Density graph | Displays the following measurement curves:
|
Gray Step - ΔE Ave. | Displays the average ΔE value for gray steps of the Exact Color target. ΔE (Delta E) denotes color difference. It represents the distance between any two points in the Lab color space. The value of ΔE represents difference between colors. |
Gray Step - ΔE Max. | Displays the maximum ΔE value for gray steps of the Exact Color target. ΔE (Delta E) denotes color difference. It represents the distance between any two points in the Lab color space. The value of ΔE represents difference between colors. |
Gray Step graph | Displays the gray balance of the gray step. Δa* (delta a star) means difference of a* from the target in a color space. Δb* (delta b star) means difference of b* from the target in a color space. |
Close | Closes the screen. |
List: Exact Color
The following items are displayed on the Calibration Manager screen.
The measurement results listed on the Calibration Manager screen can be re-sorted.
Name | Description |
|---|---|
Iteration | Displays the order that you measured charts. |
Date and Hour | Displays the date/time when the measurement was taken. |
3. Exact Color - ΔE Ave. | Displays th average ΔE value for the Exact Color target. ΔE (Delta E) denotes color difference. It represents the distance between any two points in the Lab color space. The value of ΔE represents difference between colors. |
3. Exact Color - ΔE Max. | Displays the maximum ΔE value for the Exact Color target. ΔE (Delta E) denotes color difference. It represents the distance between any two points in the Lab color space. The value of ΔE represents difference between colors. |
Menu: Exact Color
Menu | Menu Items | Description |
|---|---|---|
File | Reset | Resets the calibration data in the image controller to the settings of factory shipping. Discards the current measurement result and settings displayed on this screen, and resets the screen. |
Import Calibration file | Loads calibration data and Exact Color data from the computer. | |
Export Calibration file | Writes calibration data and Exact Color data to the computer. | |
Close | Closes the Calibration Manager screen. | |
Setting | Instrument | Specifies a colorimeter. |
Help | Help | Click to display the help. |
Version Information | Displays the version of Color Centro. |
Configuration: G7 calibration
Name | Description |
|---|---|
Information | Displays the date/time when the last calibration or scan calibration was executed. If Color Density Control is enabled, a message is displayed. |
Check the Status | Displays, per paper type for the selected screen setting, the screen type and the date/time when the data was registered. If scan calibration is executed, the relevant information is displayed in blue. |
Instrument | Displays the colorimeter that you select in Instrument on the Settings menu. |
Paper Type | Displays the paper type selected in Settings. |
Screen Settings | Displays the screen type selected in Settings. |
Settings | Allows you to set the paper type and screen type. |
Start Calibration | Starts calibration. |
Accuracy Measurement | Measures the accuracy of the calibration. |
Hide G7 Calibration | Hides 3.G7 Calibration and Gray Step. Clicking this item changes it to Show G7 Calibration. |
Show G7 Calibration | Displays 3.G7 Calibration and Gray Step. Clicking this item changes it to Hide G7 Calibration. |
Start G7 Calibration | Starts G7 calibration. |
Accuracy Measurement | Measures the accuracy of the G7 calibration. |
Report Print | Prints a report on the G7 calibration. |
CMYK Density | Allows you to select the curve to be displayed. Check to display curve. Remove check to not display curve. |
Measure D-Max | Displays measured D-Max when calibration is executed or calibration accuracy is measured. D-Max is the maximum density. It is the state in which the density is not enough. If the measured value too much higher than D-Max, the gradation may become rough. It is the state in which the output from 0% - 100% is performed with a smaller number of steps (example: 0% to 80%). |
Target | Displays the target curve for the paper recommended for the selected paper type when this item is checked. |
Density(before Calibration) | Switches between whether or not to display the graph from before the calibration. |
Density(after Calibration) | Switches between whether or not to display the graph from after the calibration. |
CMYK Density graph | Displays the following measurement curves:
|
Gray Balance | Displays a color reproduction result with the gray CMY ratio that is defined by G7, and wΔCh which is difference of saturation from the target color. |
Gray Balance graph | Displays the measurement result of Gray Balance. Δa* (delta a star) means difference of a* from the target in a color space. a* means the color shade in the direction of red to green in a color gamut. It represents that, the larger a* is, the stronger red is, and the smaller a* is, the stronger green is. Δb* (delta b star) means difference of b* from the target in a color space. b* means the color shade in the direction of yellow to blue in a color gamut. It represents that, the larger b* is, the stronger yellow is, and the smaller b* is, the stronger blue is. ΔCh (delta chroma) means difference of saturation from the target in a color space. It represents that, the higher saturation is, the more vivid colors are, and the lower saturation is, the closer colors are to achromatic colors. |
Delta-L* | Indicates the following:
|
Delta-L* graph | Displays the measurement result of Delta-L*. CMY represents the adjustment result of gray. K represents the adjustment result of the single color of K. In comparison with the target, the farther the two values (CMY and K) in the plus direction, the lighter the color, and the farther in the minus direction, the darker the color. |
Close | Closes the screen. |
Menu: G7 calibration
Menu | Menu Items | Description |
|---|---|---|
File | Reset | Resets the calibration data in the image controller to the settings of factory shipping. Discards the current measurement result and settings displayed on this screen, and resets the screen. |
Import Calibration file | Loads calibration data and G7 calibration data from the computer. | |
Export Calibration file | Exports calibration data and G7 calibration data from the computer. | |
Save LUT | Saves data for certification of G7. To use this item, perform G7 calibration. LUT = look-up table | |
Close | Closes the Calibration Manager screen. | |
Setting | Instrument | Specifies a colorimeter. |
Help | Help | Click to display the help. |
Version Information | Displays the version of Color Centro. |