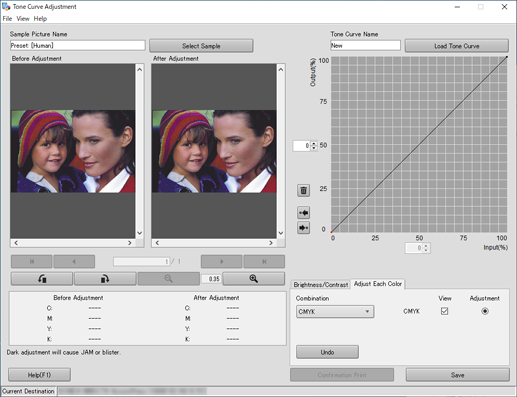
Graph Field
Overview
Operate the point on a graph, and adjust the tone curve.
A tone curve can also be operated by entering the numeric value.
- Up to 15 points can be added.
- Multiple points cannot be selected at one time.
- A point can also be operated using the up/down arrow key on the keyboard.
- To delete the added point, select it, and press the [Delete] key.
Setting Items

Setting item | Description |
|---|---|
Output value | Displays the output density (%) of the point selected on the curve display. You can also enter the numeric value and move the selected point. |
Input value | Displays the input density (%) of the point selected on the curve display. You can also enter the numeric value and move the selected point. |
 | Deletes the selected point. The starting point and ending point cannot be deleted. |
 | Select the point preceding the selected one. |
 | Select the point following the selected one. |
[Brightness/Contrast] | Adjust the brightness and contrast. You can make adjustments only using the slider without operating a tone curve. |
[Adjust Each Color] | Set a color combination when adjusting CMYK for each color. Change a combination to suit the desired adjustment. |
Setting Procedure (When Using [Brightness/Contrast])
Adjust the brightness and contrast.
Drag the slider horizontally to adjust the brightness.
You can also enter the numeric value in the entry field and adjust the brightness.
Drag the slider horizontally to adjust the contrast.
You can also enter the numeric value in the entry field and adjust the contrast.
Setting Procedure (When Using [Adjust Each Color])
Set a color combination when adjusting CMYK for each color.
Select [CMYK] to adjust the tone curve with CMYK integrated.
Select [CMY/K] to adjust the tone curve with CMY integrated and adjust the tone curve of black only.
Select [C/M/Y/K] to adjust the tone curve for each color.
The target color varies depending on the [Combination] setting.
Clear the [View] check box to hide the tone curve.

 in the upper-right of a page, it turns into
  and is registered as a bookmark.