
Density Balance Adjustment (Adjustment Flow When Changing the Screen)
Perform the density balance adjustment in the adjustment flow when changing the screen.
The density balance adjustment is required when the selection of screen and gamma automatic adjustment do not improve print results or when you want to perform the high accuracy adjustment.
The density balance adjustment measures the output chart using a spectrophotometer, and automatically correct the density balance according to the feedback of the measurement result.
Position of the Density Balance in the Adjustment Flow When Changing the Screen
The density balance adjustment is required when the selection of screen and gamma automatic adjustment do not improve print results.
 In the pre-output image quality adjustment flow, this adjustment is positioned shown below.
Screen selection
Gamma automatic adjustment
Density balance adjustment (This adjustment)
For the density balance adjustment, perform the following three processes in the order:
STEP 1: Measure the density balance using a spectrophotometer.
STEP 2: Save the measured data of the density balance.
STEP 3: Register the adjusted value of the density balance in the machine.
Controller calibration
Advanced controller calibration (Exact Color or G7 calibration)

For details about the screen selection, refer to Screen Selection (Adjustment Flow When Changing the Screen).
For details about the gamma automatic adjustment, refer to Gamma Automatic Adjustment (Regular Adjustment Flow (High Accuracy/Adjustment Flow When Changing the Screen)).
For details about the controller calibration, refer to Controller Calibration (Regular Adjustment Flow (High Accuracy/Adjustment Flow When Changing the Screen)).
For details about the advanced controller calibration, refer to Advanced Controller Calibration (Regular Adjustment Flow (High Accuracy/Adjustment Flow When Changing the Screen)).
Measuring the density balance using a spectrophotometer
To measure the chart for i1iSis or i1Pro, use the ProfileMaker Measure tool. Install the tool in advance.
You can download the ProfileMaker Measure tool free of charge at the following Web site. After installing the tool, restart the computer.
ProfileMaker 5 v5.0.10:
http://www.xrite.com /product_overview.aspx?ID=757&action=support&softwareID=951To use the spectrophotometer i1iSis, perform Step 10 (select [Measure] from the menu) followed by the procedure of "• For the spectrophotometer i1iSis."
To measure the chart for FD-5BT, use the ColorCare Measure supplied with FD-5BT or FD-S2w, utility software which can be downloaded from the web site. Install one or the other in advance.
To use the spectrophotometer FD-5BT, perform Step 7 and later referring to the instruction manual of Color Measure or FD-S2w.
To measure the chart for FD-9, use FD-S2w, utility software which can be downloaded from the web site. Install the tool in advance.
To use the spectrophotometer FD-9, perform Step 7 and later referring to the instruction manual of FD-S2w.
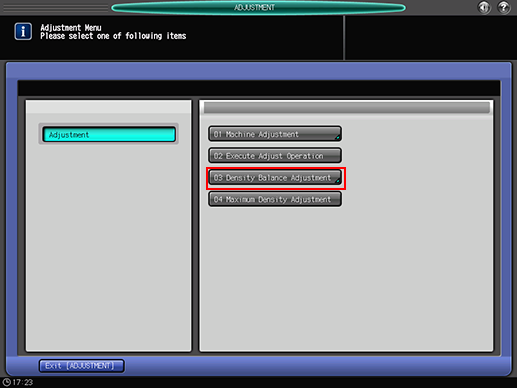
On the touch panel of the main body, press [Adjustment] on the [MACHINE] screen.
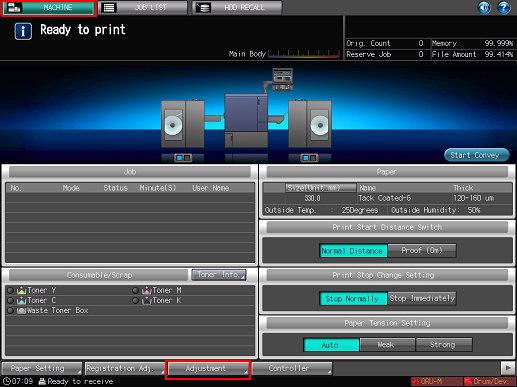
The [Adjustment Menu] is displayed.
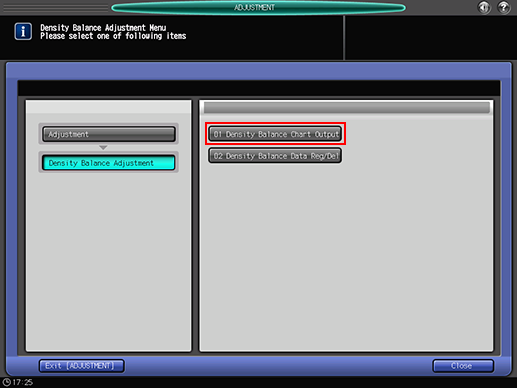
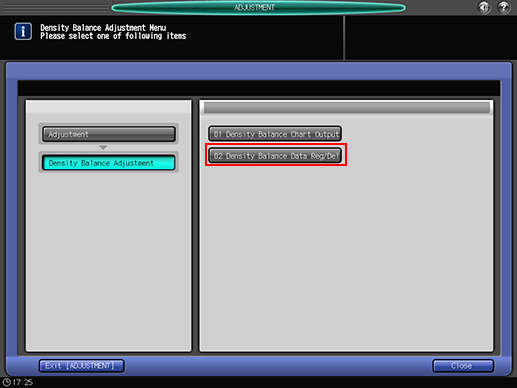
Press [Density Balance Adjustment] on the [Adjustment Menu] screen.

Press [Density Balance Chart Output].
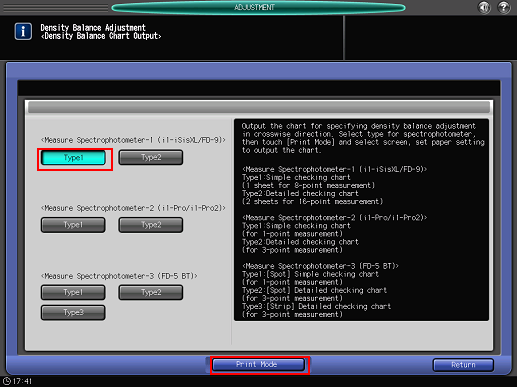
Select the chart to be output according to the spectrophotometer to be used.
After the selection, press [Print Mode].
For adjustment with a higher degree of accuracy, the [Type-1] of [<Measure Spectrophotometer-1 (i1-iSisXL/FD-9)>], the [Type-2] of [<Measure Spectrophotometer-2 (i1-Pro/i1-Pro2)>], or the [Type-3] of [<Measure Spectrophotometer-3 (FD-5 BT)>] is recommended.
Item
Description
[Measure Spectrophotometer-1 (i1-iSisXL/FD-9)]
[Type 1]
Simple checking chart for 8-step gradation
[Type 2]
Detailed checking chart for 16-step gradation
[<Measure Spectrophotometer-2 (i1-Pro/i1-Pro2)>]
[Type 1]
Simple checking chart for 1-step gradation
[Type 2]
Detailed checking chart for 3-step gradation
[<Measure Spectrophotometer-3 (FD-5 BT)>]
[Type 1]
Simple checking chart for 1-step gradation (Spot measurement)
[Type 2]
Detailed checking chart for 3-step gradation (Spot measurement)
[Type 3]
Detailed checking chart for 3-step gradation (Strip measurement)
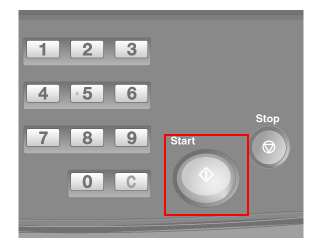
Set the paper on the [PRINT MODE] screen and press Start on the control panel.
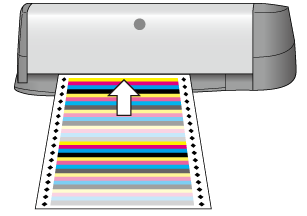
The color chart is output for measurement using the spectrophotometer.

If the winding motor is stopped, refer to Prepare the Machine.
Cut out a printed test chart from the media core of Roll Winder RW-201.
When cut out the printed chart, refer to Cutting the output paper and be careful not to injure your hands or fingers.
The subsequent operations are described for the case where the spectrophotometer i1-Pro/i1-Pro2/i1 iSis XL is used.
If you use FD-5BT/FD-9, refer to the user's guide of the selected colorimeter.
On the computer where the ProfileMaker Measure tool has been installed, select [Start] - [All Programs] - [X-Rite] - [ProfileMaker Pro 5.0.10] - [MeasureTool].
ProfileMaker Measure tool starts.
The following description uses screen examples in English. To change the display language for the menu and messages, select the language from [Language] - [English] on the Measure Tool toolbar, and then restart the ProfileMaker Measure tool.
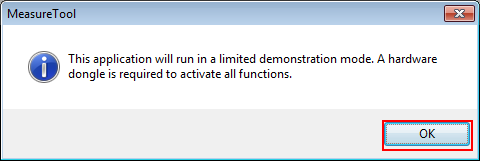
When the following message is displayed, click [OK].
Connect the instrument to the computer. From the menu, click [Configuring].
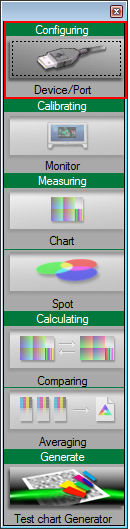
The [Instrument Configuration] screen is displayed.
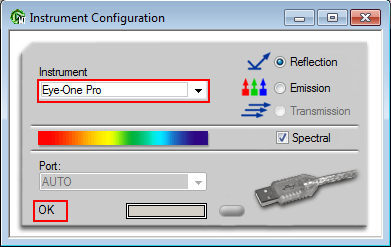
In [Instrument], select the spectrophotometer to use. When [OK] is displayed, close the screen.
Example: This example selects [Eye-One Pro] (i1Pro).
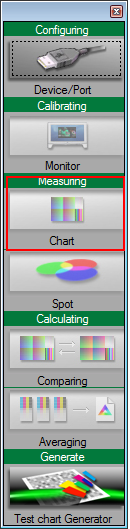
From the menu, click [Measuring].
The subsequent operations are described for the case where the spectrophotometer i1Pro is used. For measurement using the spectrophotometer i1iSis, refer to "• For the spectrophotometer i1Sis."
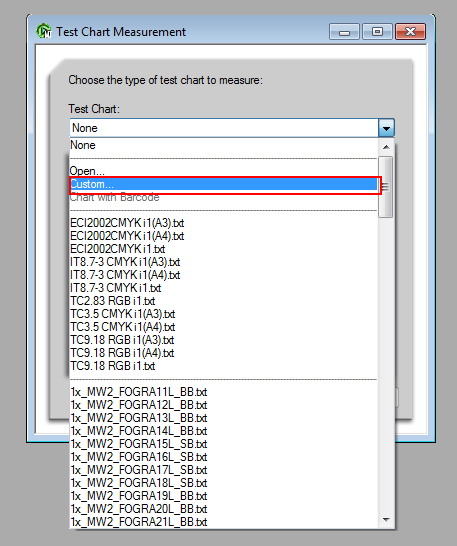
From [Test Chart], select [Custom].
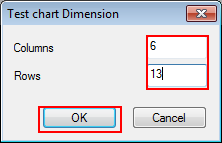
Specify [Columns] and [Rows], and click [OK].
When the spectrophotometer is "Type 1" of i1Pro: [Columns] = 6, [Rows] = 5
When the spectrophotometer is "Type 2" of i1Pro: [Columns] = 6, [Rows] = 13
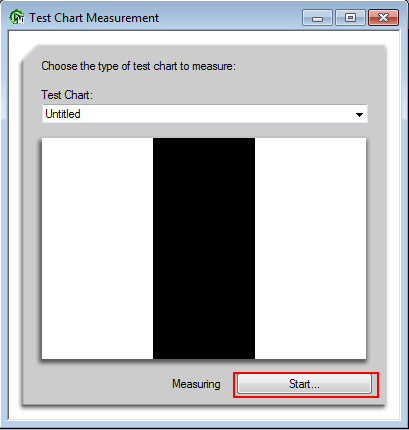
Click [Start].
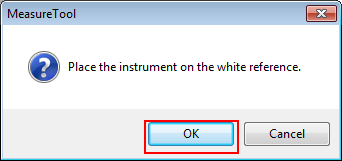
When the following message is displayed, horizontally place the spectrophotometer on the calibration dock and click [OK].
Stack 10 sheets of blank paper whose type is the same as that of the paper where chart has been printed, and place the printed chart on top of it.
To eliminate the influence of the color of the table, place 10 sheets of paper of the same type as the chart underneath the chart to be measured.
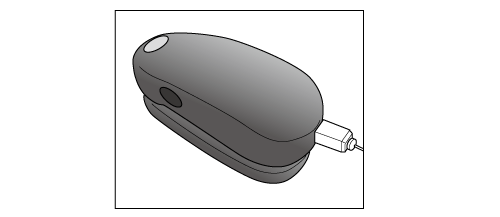
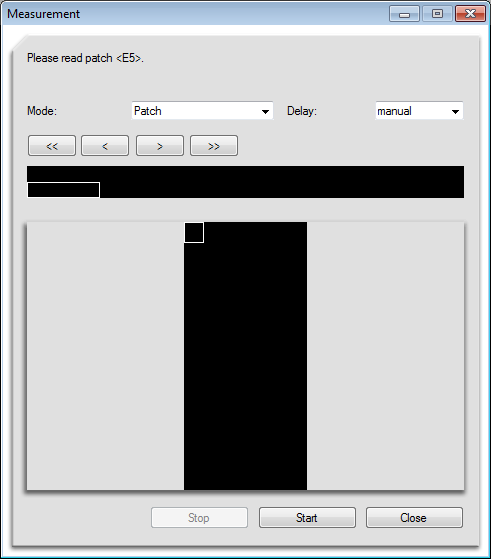
When the following screen is displayed, place the spectrophotometer on the patch at the top in the upper left, and press the button for the spectrophotometer. When beep sounds, check that the read patch is displayed on the screen.
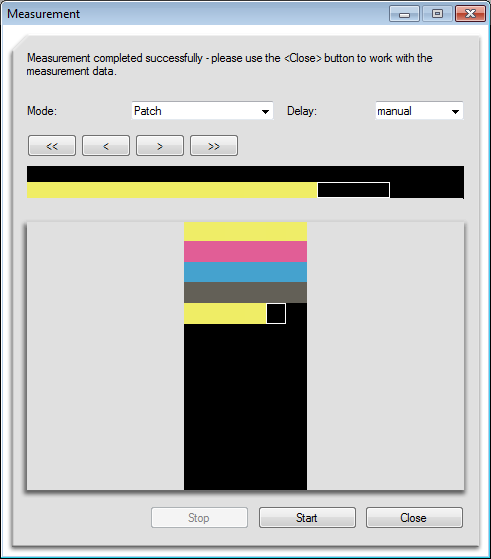
Continuously, place the spectrophotometer on the next right patch, and press the button for the spectrophotometer. Measure all the patches in the same operation.
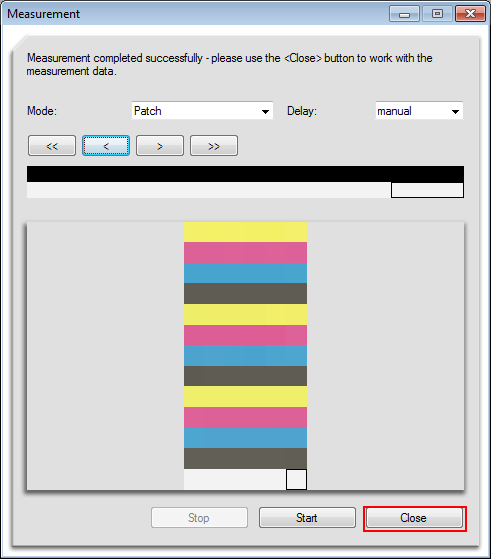
If you place the spectrophotometer on the wrong place (patch), click the
 button to go back to the previous patch position.
The white portion where it is displayed that nothing is printed is also part of the patch. Do not forget to measure it. If not measured, an error will occur.
When you are finished with the chart measurement, click [Close].
Continuously, go to "Saving the measured data of the density balance," and save the measurement data.
• For the spectrophotometer i1iSis
To use the spectrophotometer i1iSis, perform Step 10 (from the menu, select [Measure]) followed by the procedure below.
From [Test Chart], select [Open].
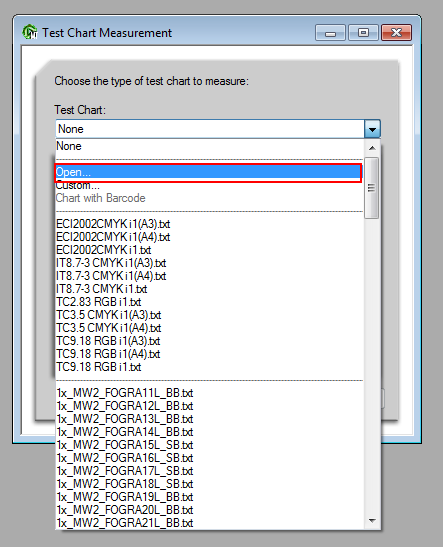
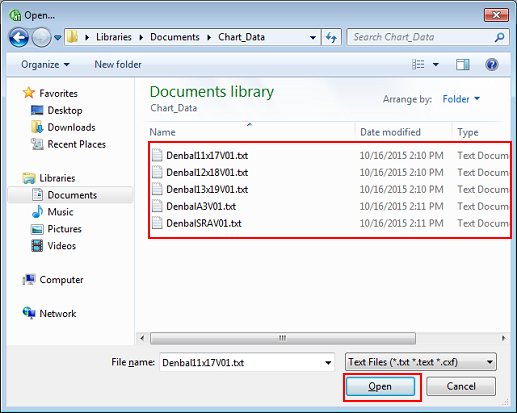
Select the script data for measurement according to the paper size, and click [Open].
For details about the script data, contact your service representative.
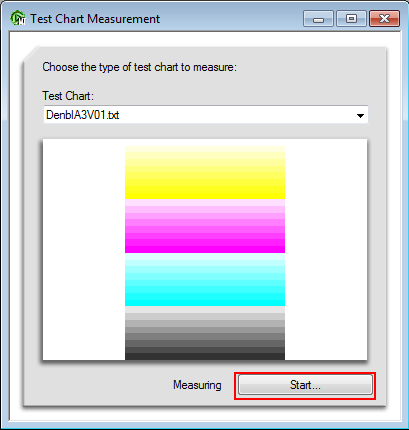
On the following screen, click [Start].
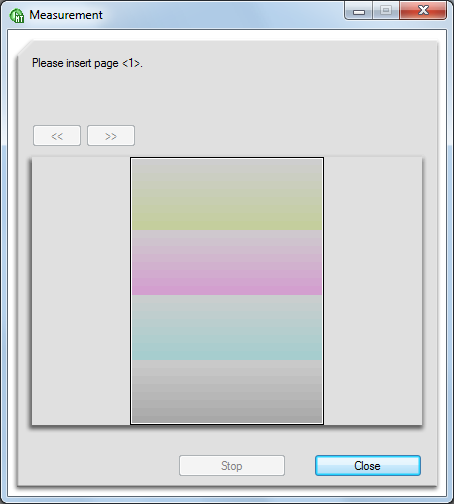
When the following message is displayed, insert the chart into i1isis.
Cut off the front edge of the chart using scissors or such other tools so that the length between the front edge and the bar on the chart becomes about 30 mm/ 1.18".
Cut off the left side of the chart using scissors or such other tools so that the length between the left end of the chart and the black diamond symbol (♦) becomes about 10 mm/0.39".
Align the left end of the paper to the left end of the insert opening of i1isis, and automatically feed the paper one by one. When correctly inserted, the chart is pulled in a few centimeters and comes back a little, and then after a little while, reading starts.
Measurement automatically starts.
Saving the measured data of the density balance
You can save the data of the density balance measured with the spectrophotometer to a USB device such as a USB memory stick or to the computer on the network used by the machine.
From the [File] menu, select [Save As].
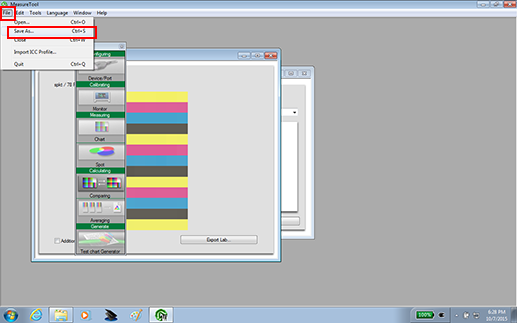
If you use [Export Lab], an error occurs when registering the color adjustment data. When saving the data, always use [Save As].
Specify the destination to save.
Specify USB memory or the computer connected to the machine via the network.
Destination to save
Description
USB Memory
Connect the USB memory to the computer.
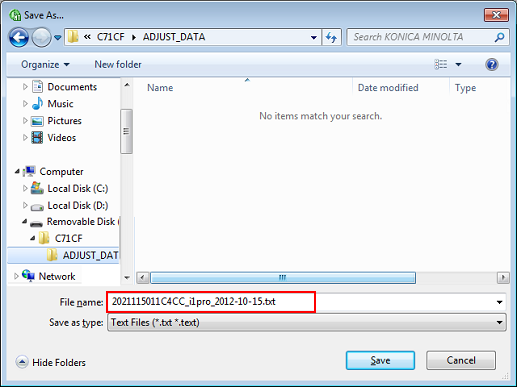
Create a folder, ''\C71CF\ADJUST _DATA,'' in the root (immediately below) of the USB memory, and specify the place as the destination to save.
Computer on the network
Open the computer connected to the network used by the machine, and specify a desired folder.
Enter the file name to save the measured data and click [Save].
Specify the "14-character identification number printed on the chart" + "_" (underscore) + "character string of up to 21 characters."
Example: 2021115011C4CC_i1pro_2012-10-15.txt
The measured data of the density balance is saved.
Registering the adjusted value of the density balance in the machine
You can register the measured data (adjusted value of the density balance) saved in the USB memory or the computer on the network in the machine.
Place to save measured data | Operation |
|---|---|
Measured data saved in the USB memory | Connect the USB memory and register the data using the touch panel of the main body. Refer to "• Registering the measured data saved in the USB memory." |
Measured data saved in the computer on the network | Send (upload) the measured data using Web Utilities from the Web browser and then register the data. For details about Web Utilities, refer to Overview of Web Utilities. Refer to "• Registering the measured data saved in the computer on the network." |
• Registering the measured data saved in the USB memory
On the touch panel of the main body, press [Adjustment] on the [MACHINE] screen.
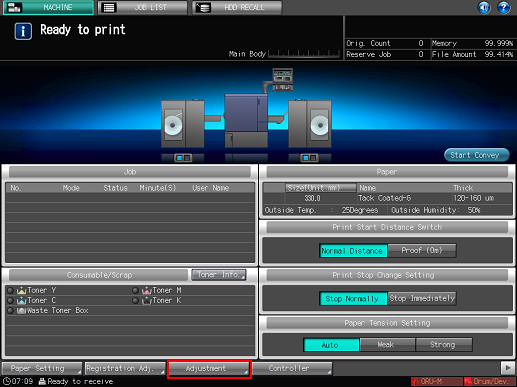
The [Adjustment Menu] is displayed.
Press [Density Balance Adjustment] on the [Adjustment Menu] screen.
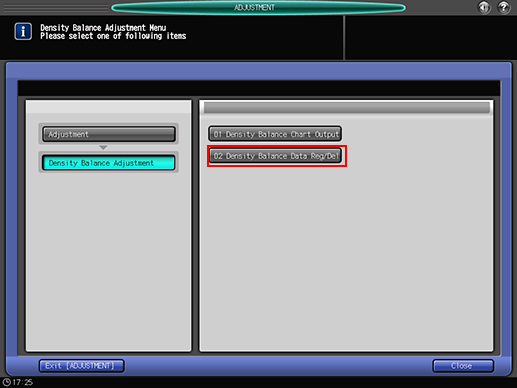
Press [Density Balance Data Reg/Del].
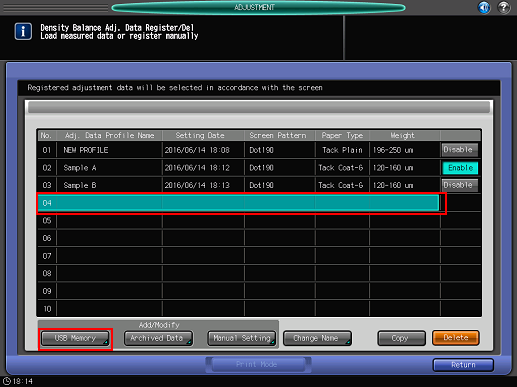
Select the number where the adjusted value is to be registered and press [USB Memory].
If you select the registered number, the adjusted value is overwritten.
The following screen is displayed. Connect the USB memory where the measured data has been saved to the main body, and press [OK].
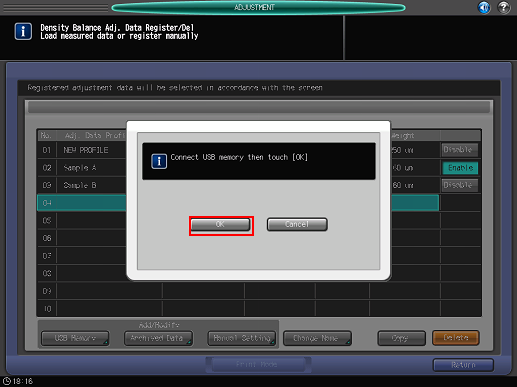
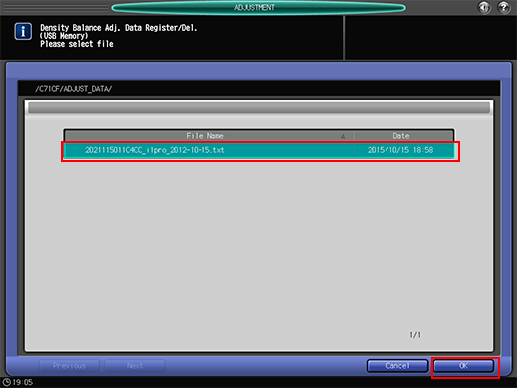
Select the file name of the measured data to be registered and press [OK].
When the following screen is displayed, press [OK].
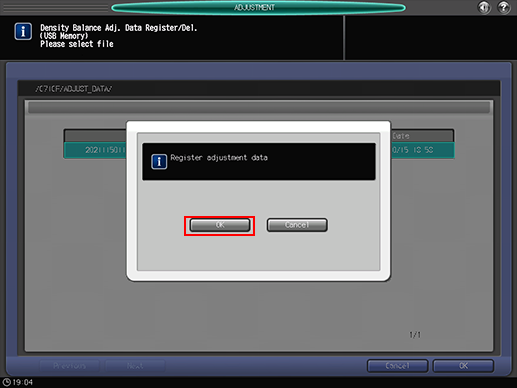
The adjusted value of the density balance is registered.
• Registering the measured data saved in the computer on the network
On the computer on the network where the measured data has been saved, open a Web browser.
It is recommended that you log in to Web Utilities from the computer where the measured data has been saved.
In the URL field, enter "http://IP address of the machine (or the host name):30091" and press the Enter key.
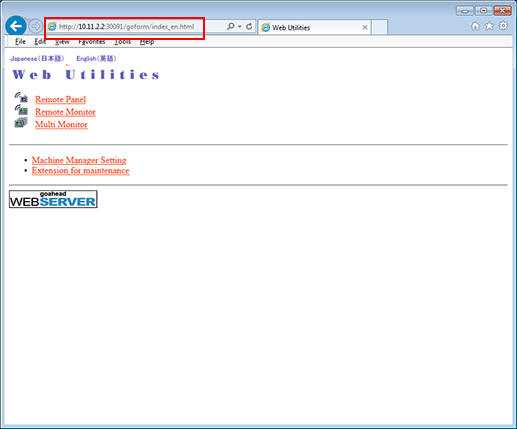
The main page of the Web Utilities is displayed.
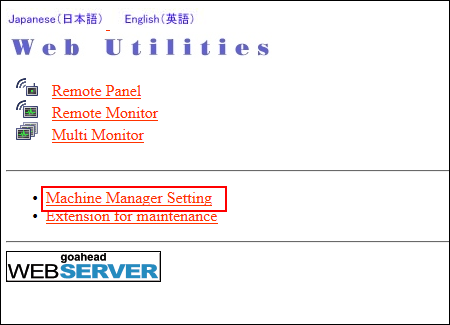
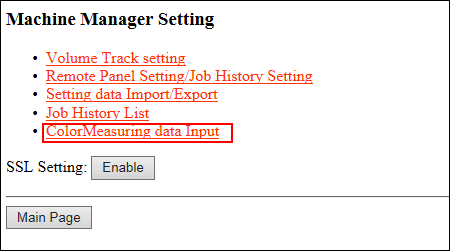
Click on [Machine Manager Setting].
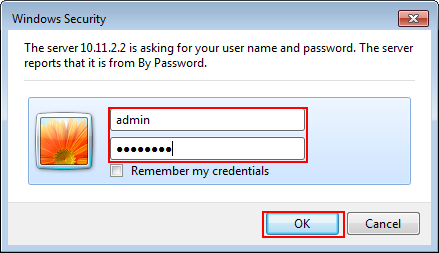
Enter the [User Name] and [Password] and click [OK].
Click on [Color Measuring data Input].
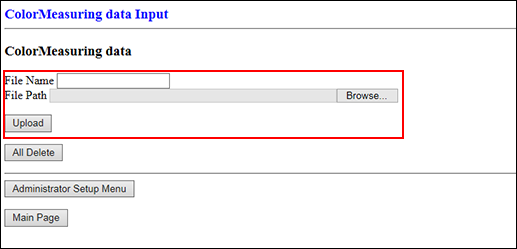
Specify the [File Name] and [File Path] and click [Upload].
Enter the file name (Example: 2021115011C4CC_i1pro_2012-10-15.txt).
Click [Reference] of the [File Path] and select the measured data saved in the computer.
On the touch panel of the main body, press [Adjustment] on the [MACHINE] screen, and then press [Density Balance Adjustment] on the [Adjustment Menu] screen.
Refer to Steps 1 and 2 of "• Registering the measured data saved in the USB memory."
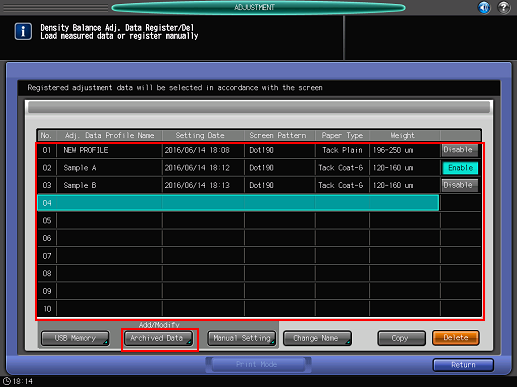
Press [Density Balance Data Reg/Del].
Select the number where the adjusted value is to be registered and press [Archived Data].
If you select the registered number, the adjusted value is overwritten.
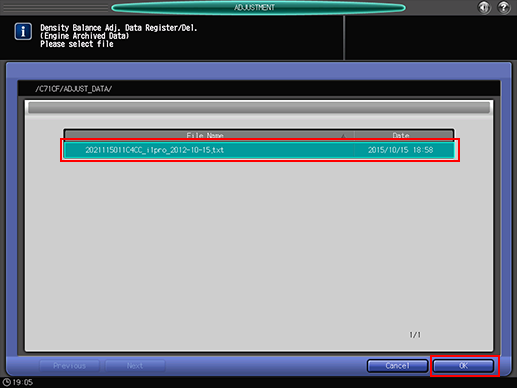
Select the file name of the measured data to be registered and press [OK].
When the following screen is displayed, press [OK].
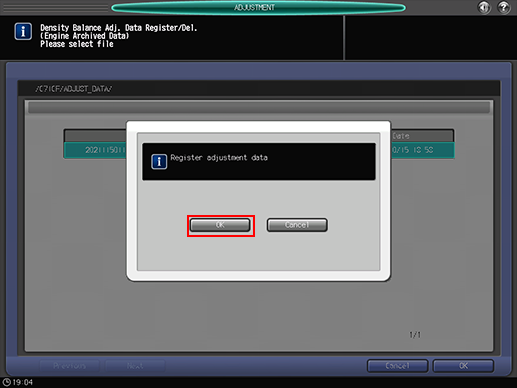
The adjusted value of the density balance is registered.