
Adj. of Color Sensor for Each Paper Type: Registering the Sensor Adjustment Data That is Adjusted to Paper Type (Color Sensor Adjustment Data for Each Paper Type)
Color Density Control uses the sensor adjustment data that becomes the base of correction. There are two types of sensor adjustment data as below.
• Sensor adjustment data that has been set as default with shipment (Default Sensor Adjustment Data)
• Sensor adjustment data that is adjusted to a particular paper type and screen (Color Sensor Adjustment Data for Each Paper Type (Custom Sensor Adjustment Data))
Register the color sensor adjustment data for each paper type to the machine in advance by using the Spectrophotometer i1iSis XL, i1Pro, or FD-5 BT.
This section describes the chart output for creating color sensor adjustment data for each paper type.
The number of output chart sheets varies depending on the paper size.
Group | Details | Number of output chart sheets |
|---|---|---|
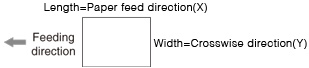
Large sizes | Length (X) is 271.0 mm or more, and width (Y) is 168.0 mm or more. | 3 sheets |
Medium sizes | Length (X) is 210.0 mm to 270.9 mm, and width (Y) is 168.0 mm or more. | 4 sheets |
Small sizes | Length (X) is less than 210.0 mm, and width (Y) is 168.0 mm or less. | If [Chart Tray Setting] is set to [ON], a large size or medium size is output in accordance with the setting. If it is set to [OFF], no sheet is output (no correction). |
* Definitions of length (X) and width (Y) | ||
This section describes how to create the colorimetric data using the spectrophotometer.
Prepare spectrophotometer i1iSis XL, i1Pro, or FD-5 BT, computer connected to the spectrophotometer, and USB flash drive. USB flash drive formatted in FAT or FAT 32 file system can be detected on the machine. USB flash drive with the U3 platform or security feature cannot be used.
Use the ProfileMaker Measure Tool when the Spectrophotometer i1iSis XL or i1Pro is used. Use Color Care measure or FD-S2w when the Spectrophotometer FD-5 BT is used.
When the ProfileMaker Measure Tool is used, the message [This application will run in a limited demonstration mode. A hardware dongle is required to activate all functions.] is displayed. However, the tool can be operated without the hardware dongle.
When operating the ProfileMaker Measure Tool on a computer, click [Open] to select a script file corresponding to the chart size. For details of the script file, contact your service representative.
A license key is required to use Color Care measure. For details, refer to the user's guide included with Color Care measure.

The number of sheets output as charts is included in the print count.
The following describes how to save colorimetric data of the spectrophotometer.
When using the Spectrophotometer i1iSis XL to create the colorimetric data, cut off the left edge of the chart leaving the edge positioning line on the yellow side of the chart before scanning it.
The chart for Color Density Control is available in two types: large and medium sizes. When using the Spectrophotometer i1Pro to create the colorimetric data, use a computer to enter the number of row and column of color chips printed on the chart before measuring each type.*
On the Color Care measure screen, select a chart based on the number of the color chips. Select a chart that matches the number of row and column of color chips printed on the chart. Select a chip to be measured first from the top right and then start the measurement.
When the measurement using the ProfileMaker Measure Tool is completed, click [Close] on the computer screen to display another window. On the screen, always click [File] from the tool bar and save as a new file. You can also do the same by pressing the shortcut key, [Ctrl]+[S]. The data saved by clicking [Export Lab...] cannot be recognized on the machine.
To save the colorimetric data on a USB flash drive, set the path [\C1100\ADJUST_DATA] to the drive, and save the data in the lowest folder that is the ADJUST_DATA folder. The number of files to be saved is the same as the number of printed paper. The file name is a 4-digit number printed on the chart (2-digit adjustment number of the color sensor for each paper type + 1-digit total page count + 1-digit page number).
Multiple sheets of chart are output. Measure the chart to save the colorimetric data and repeat this for the all charts sheet by sheet.
A password is required if you are registering the colorimetric data via Web using Color Care measure. Enter the administrator password previously specified on the machine.
Also, you must enter the identifying information of 4-digit number printed on the chart (2-digit adjustment number of the color sensor for each paper type + 1-digit total page count + 1-digit page number) and the IP address for this machine.
* The notes about print color chips and color measurement are as follows:
Size | Printed color chip | Color measurement notes |
|---|---|---|
Large sizes | 11 rows and 4 columns, 44 color chips in total | Although the first 2 rows seem to be colorless, you need to measure the color chips of this area. |
Medium sizes | 8 rows and 4 columns, 32 color chips in total |

Refer to the user's guide of the spectrophotometer for usage.
When registering colorimetric data, the following error messages may be displayed.
Deal with problems as instructed in the messages.
Error Message | Error Message |
|---|---|
Data Error | File Name Error |
Number-of-Data Error | File Data Error |
Data Saving Error |